Thanks to an absolute boom of event technology solutions, event planners can now craft data-based event strategies and measure their event success better than ever before. First, planners define their event goals – what they want to achieve with this event – and break them down into measurable event KPIs. Event KPIs (key performance indicators) therefore directly drive event ROI and inform how successful was the event.
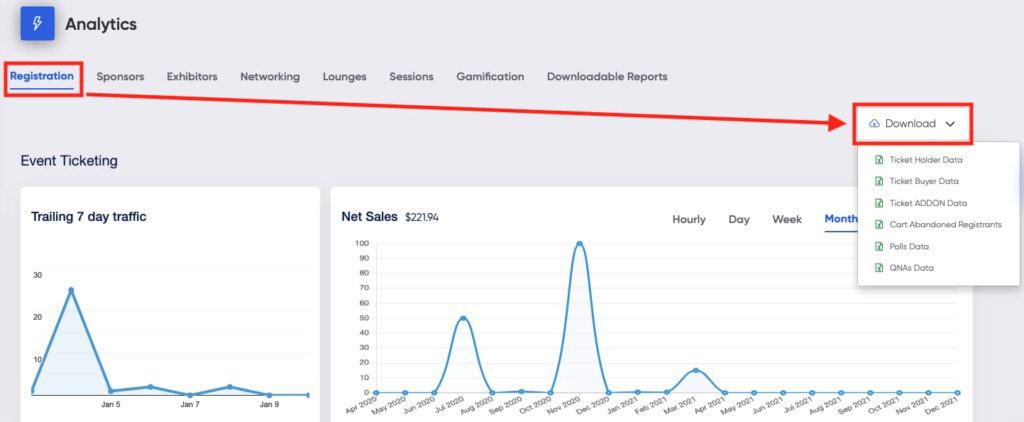
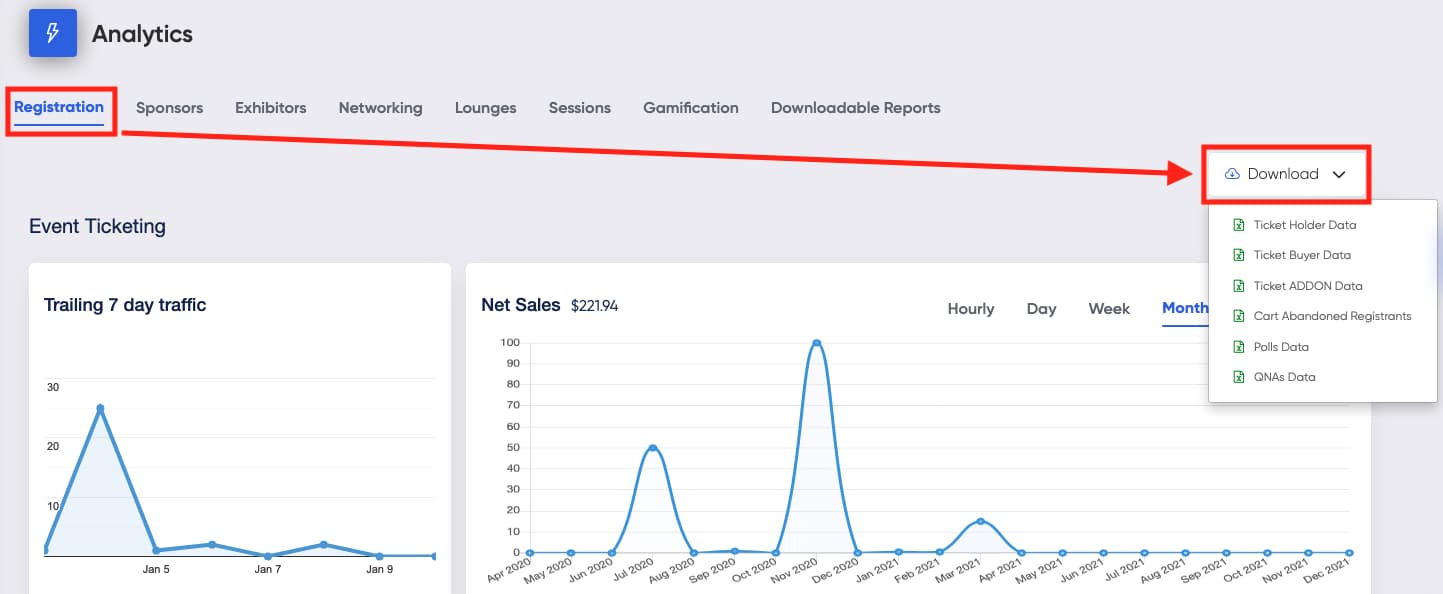
Once the KPIs are set, they need to be measured to determine event ROI. The best way to measure event ROI is with event platforms as they harness valuable data points and create analytics reports. However, platforms differ from one another based on pricing, features, and other functionalities. It’s important that event planners compare several event platforms by features and assess their analytics capabilities.

Not every KPI is relevant and important to every event, though. There are no one-size-fits-all best metrics for event planners. While the main event goal of some events is to sell as many tickets as possible, others strive for higher brand recognition or good event marketing metrics.
We’ve outlined 77 event KPIs and divided them into eight major groups:
- general and attendee event KPIs,
- financial event KPIs,
- marketing KPIs,
- audience engagement KPIs,
- presenter KPIs,
- sponsorship and tradeshow KPIs,
- event networking KPIs,
- community KPIs.
We’ve outlined several in each group. Hopefully, some of these will help inspire you to embrace the benefits of event platforms and take your event strategy to the next level. Happy planning!
 Registration & Attendee KPIs
1. Number of total registrations
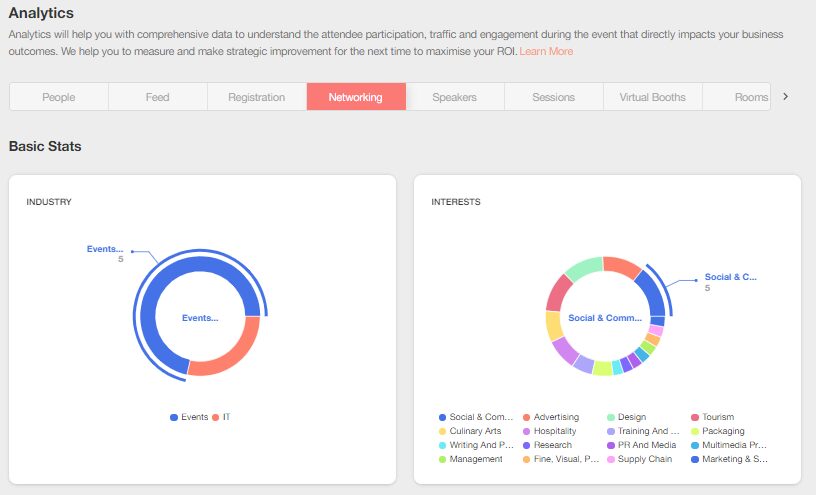
2. Attendee demographics: age, region, job title, industry. There is also value in measuring psychographics and valuegraphics (for example, to assess how much your attendees value sustainability or how they feel about attending an in-person event)
3. Attendee retention: how many attendees have attended the event before (loyalty rate);
4. Turnout percentage: how many people attended the event out of all that registered (in case of virtual events, how many people logged into the event platform)
5. Active people in the event platform each hour
6. Pageviews on the registration microsite
7. Post-event surveys: measure level of attendee satisfaction and overall event success
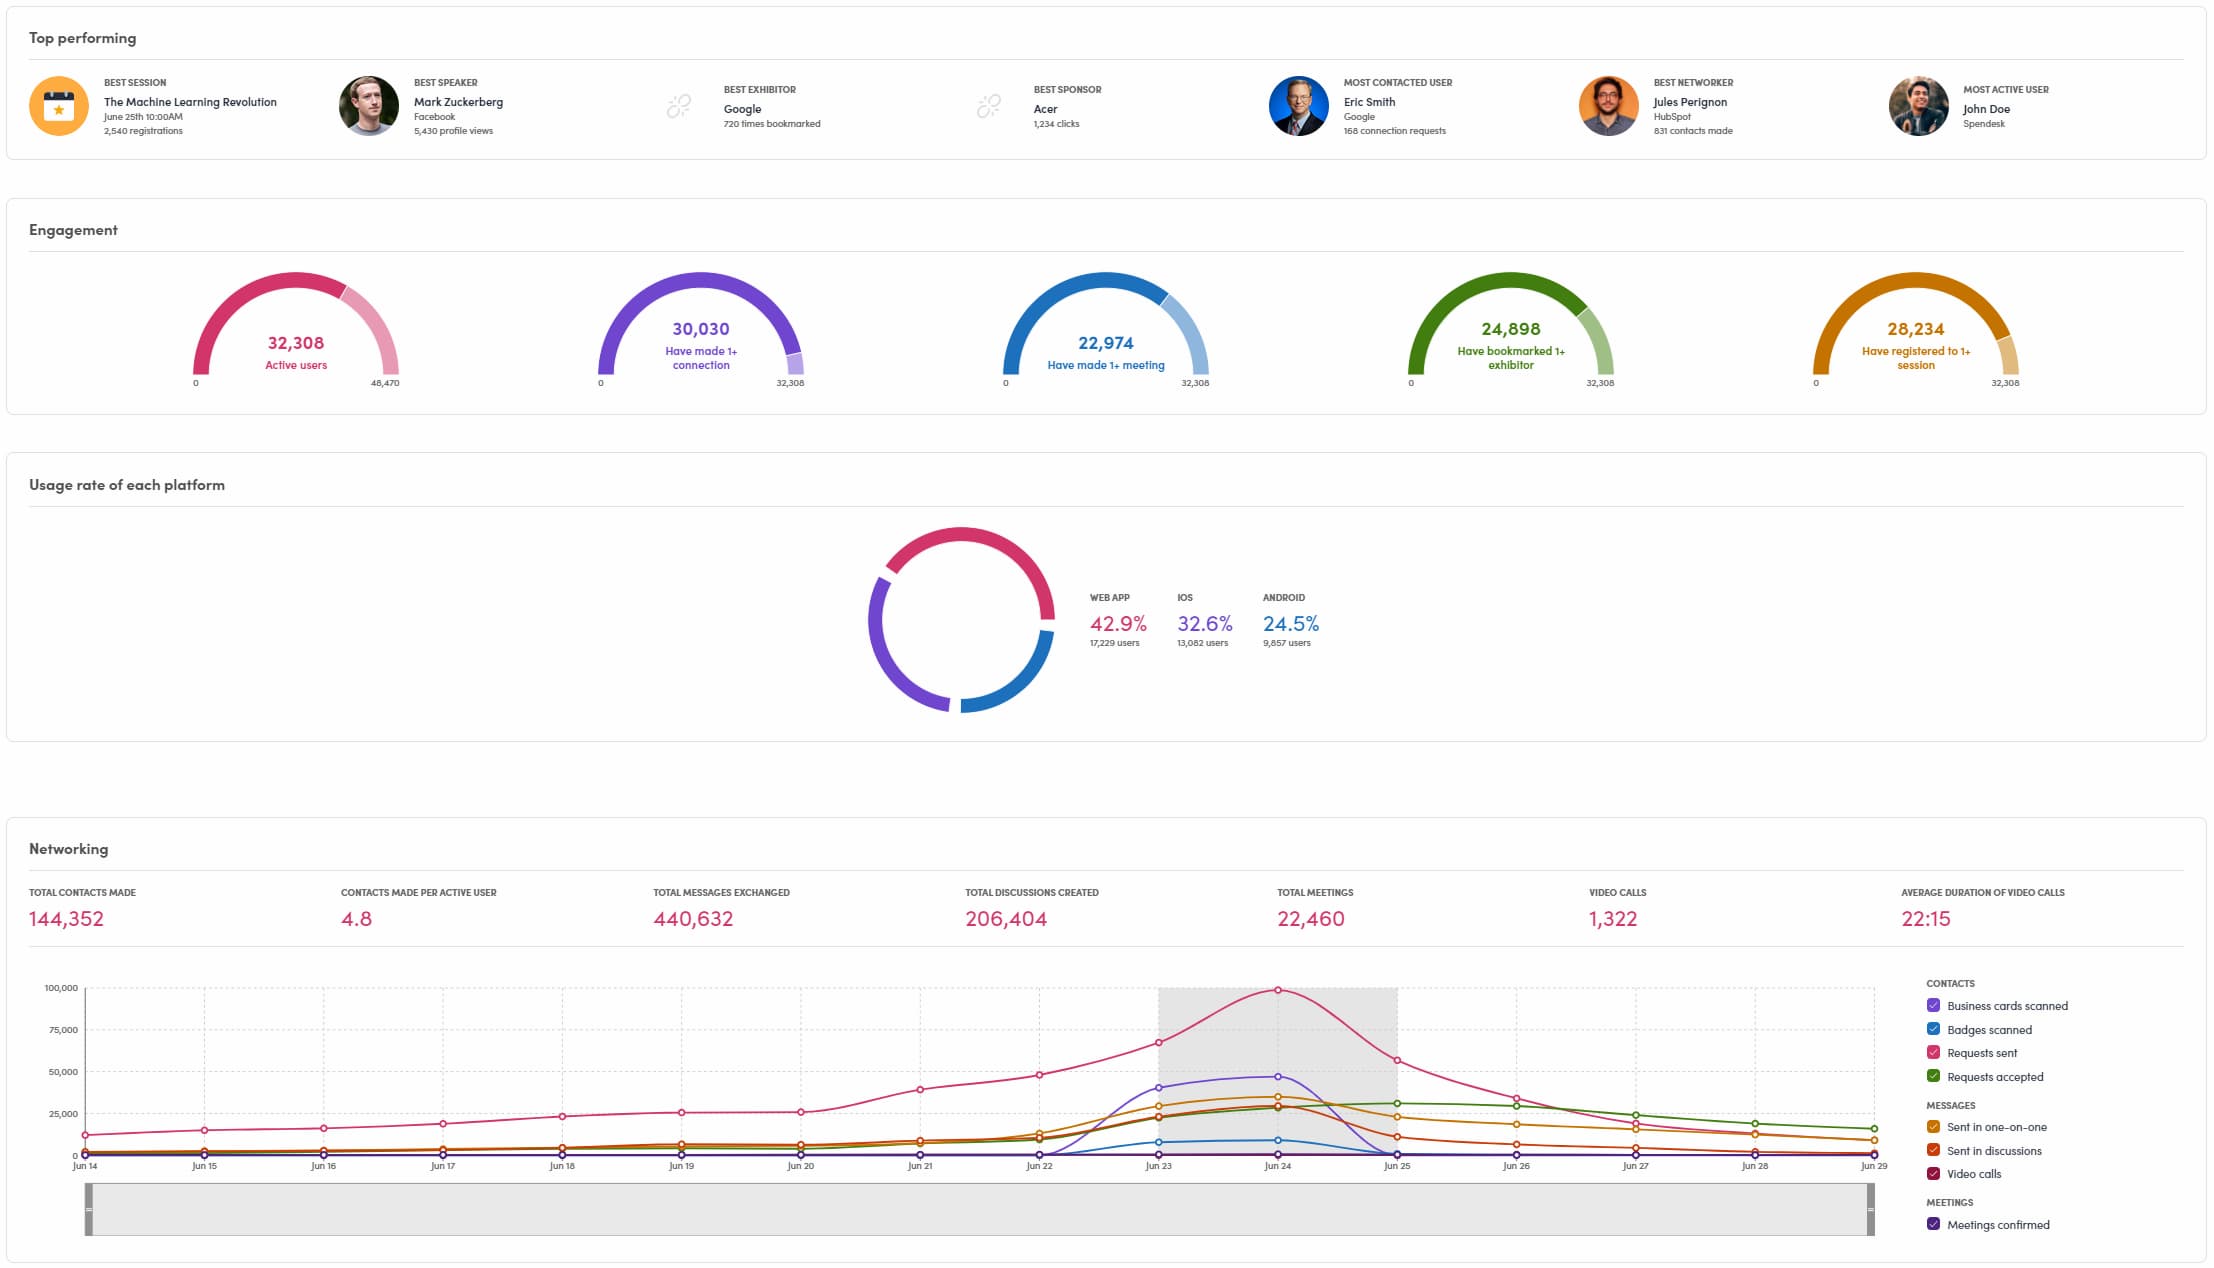
8. Device usage: Android, iOS, computer
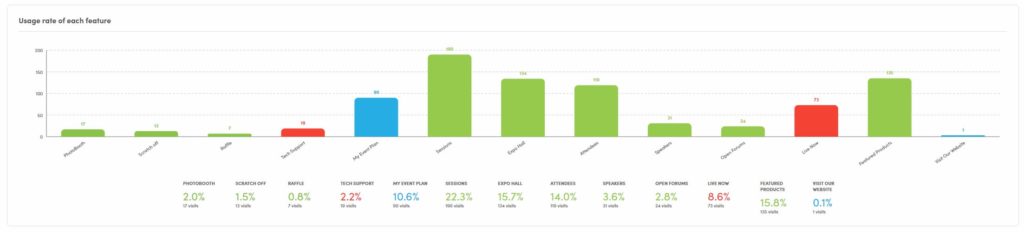
9. Usage rate of each event platform features
 Financial Event KPIs

10. Gross profit and net profit of the event
11. Tickets, sold by type: several ticket tiers, including virtual event attendance, in-person admission, early bird tickets, VIP tickets, etc.
12. Average number of tickets per purchase
13. Total number of ticket orders
14. The average revenue per attendee
15. Tickets sold by date
16. Donations received
17. Refunds issued
18. Incomplete orders
19. Average time spend per order
20. Processing fees paid
Marketing KPIs
21. Email open rate
22. Push notification open rate
23. Discount codes
24. Discount codes used by attendees
25. Website traffic by promo codes: see which sponsors or promo codes drove the most traffic to your event website
26. RSVPs to your next event responded during the event: this event marketing KPIs is crucial for building your own community
27. Social media mentions: create your own event hashtag or social media profiles
Engagement KPIs
Event platforms have transformed how we measure audience engagement KPIs. Event gamification can help support getting better results on these KPIs. help you reach your event goals. Virtual event metrics
28. In-person and/or virtual attendees per session: including drop off rate
29. Session watch duration: in seconds or minutes; including average session duration
30. Live polling response rate
31. Total Q&As, including sessions with the most Q&As, the number of question upvotes
32. Q&As answered vs. unanswered
33. Total session replays
34. Session with most chats
35. Number of hands raised, including virtually
36. Most/least registered session
37. Session rating: including metrics about top-performing sessions and topics (either by attendance or high rating)
38. Chats per session
39. Session feedback survey results
40. Event feed posts: number of likes and comments
41. Posts per discussion forum
 Presenter KPIs
42. CFP (call for papers) received
43. Speaker profile visits
44. Speakers logged in: number or %
45. Average speaker rating
46. Most/least bookmarked speakers
Tradeshow KPIs
47. Exhibitor retention: how many exhibitors are returning and how many are new
48. Exhibitor lead captures: first, exhibitors need to define which metrics determine a qualified lead; other lead-related event KPIs include the number of opportunities and close rate
49. (Virtual) Business cards dropped
50. Booth visits/product views
51. Participation in gamified challenges: raffles, giveaways
52. Sponsor revenue
53. Sponsor/exhibitor satisfaction: measure with a survey
54. Cost per lead: how much money one lead costs, on average
55. Most/least bookmarked exhibitors, products, or services
56. CTA clicks
57. Product views
58. Files downloaded
59. Chats per booth
60. Average contacts per exhibitor
61. Total meetings held with exhibitors
62. Sponsor logos clicked

Event Networking KPIs
63. Total contacts made
64. Contacts made per active user
65. Profile views: who were the most viewed/active attendee profiles
66. Meetings scheduled in an app/platform
67. Meetings held in-person versus virtually
68. Meetings declined
69. Contact scoring: giving conversations 1-5 stars, if your event platform allows you to score conversation
70. Connection requests sent in the event platform
71. Connections made: requests accepted
72. Group networking event KPIs: number of people who participated in video rooms, video lounge; average time per user spent networking
 Community Community KPIs
The community model holds many perks, including continuous audience engagement, infinite virtual space for events and webinars, and year-round value for exhibitors. Have your attendees, sponsors, and stakeholders all share a virtual space before, during, and after the event, and make it an event platform (or in this case, a community platform) the base of your multi-event strategy.
While most event KPIs only concern a time-bound event, community KPIs offer data insights into the behavior and interests of your community members throughout the entire year.
73. Active/inactive members
74. Logins/day of the week
75. People online per time (hour) of day
76. New members
77. Posts/interactions

Pave The Way To Event Success With Event KPIs
Event planners who strategize, set goals, and measure the corresponding event KPIs are far more likely to scale their events and reach new heights of event success. There are many different types of event KPIs event platforms can measure, so it’s crucial that planners find the platform that will best support their vision and improve event ROI.
At Endless Events, we pride ourselves in being technology-agnostic event partners, dedicated to helping planners pave the way to event success. If you need help with event strategy, event technology implementation, community nurturing, and anything else event-related, reach out to us – we’re a forward-thinking event management company you will love to work with.